Panther SIEM
Panther is a security information and event management (SIEM) platform that can be used with Bitwarden organizations. Organization users can monitor event activity with the Bitwarden app on their Panther monitoring system.
To start you will need a Panther account and dashboard. Create a Panther account on their website.
Access the Panther dashboard.
On the menu, open the Configure dropdown and select Log Sources.

Panther Log Sources Select Onboard your logs.

Panther Onboard logs Search Bitwarden in the catalogue.
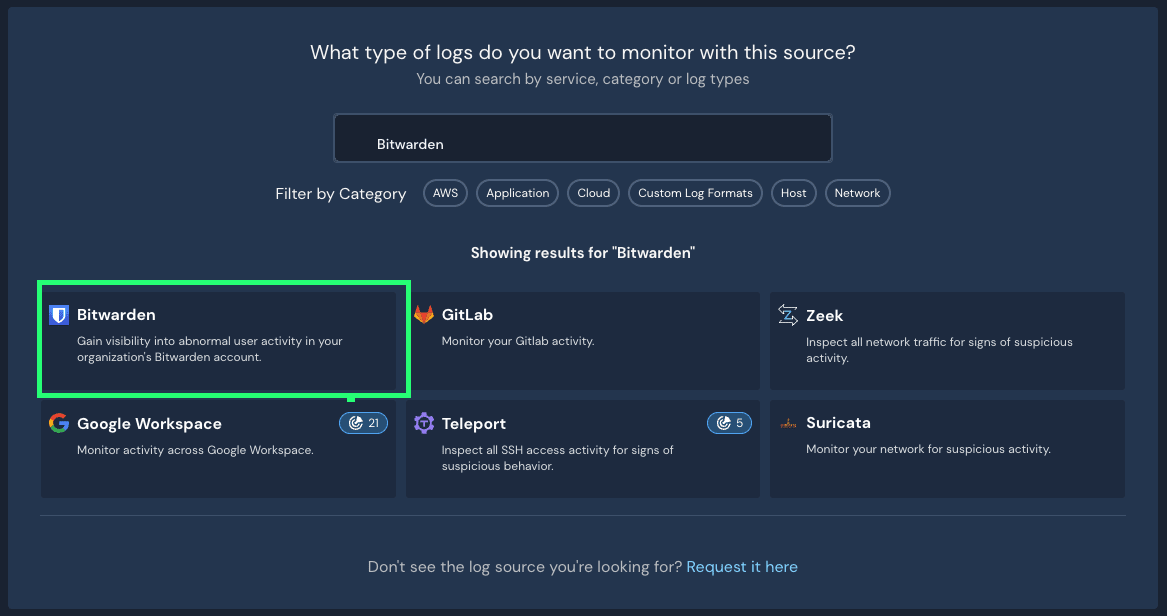
Elastic Bitwarden integration Click on the Bitwarden integration and select Start Setup.
After you select Start Setup you will be brought to the configuration screen.
note
Panther SIEM services are only available for Bitwarden cloud hosted organizations.
Enter a name for the integration and then select Setup.
Next, you will have to access to your Bitwarden organization's Client ID and Client Secret. Keeping this screen open, on another tab, log in to the Bitwarden web app and open the Admin Console using the product switcher ():
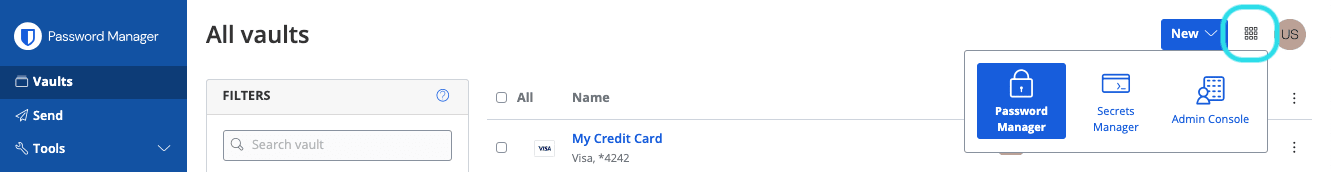
Product switcher Navigate to your organization's Settings → Organization info screen and select the View API key button. You will be asked to re-enter your master password in order to access your API key information.
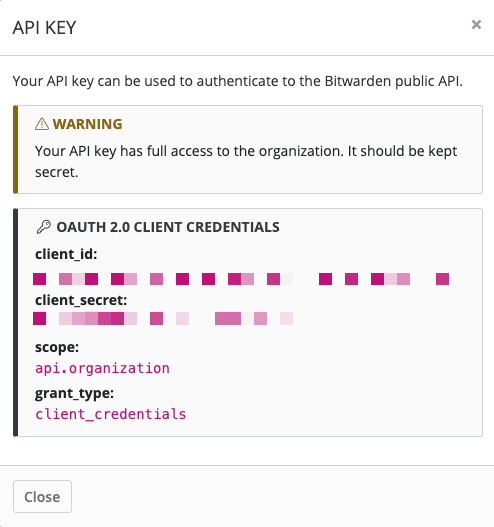
Organization api info Copy and paste the
client_idandclient_secretvalues into their respective locations on the Bitwarden App setup page. Once you have entered the information, continue by selecting Setup again.Panther will run a test on the integration. Once a successful test has been completed, You will be given to option to adjust preferences. Complete the setup by pressing View Log Source.
note
Panther may take up to 10 minutes to ingest data following the Bitwarden App setup.
To begin monitoring data, head over to the primary dashboard and select Investigate and Data Explorer.
On the Data Explorer page, select the
panther_logs.publicdatabase from the drop down menu. Make sure thatbitwarden_eventsis being viewed as well.
Panther Data Explorer Once you have made all of your required selections, select Run Query.
You may also Save as to use the query at another time.A list of Bitwarden events will be produced at the bottom of the screen.
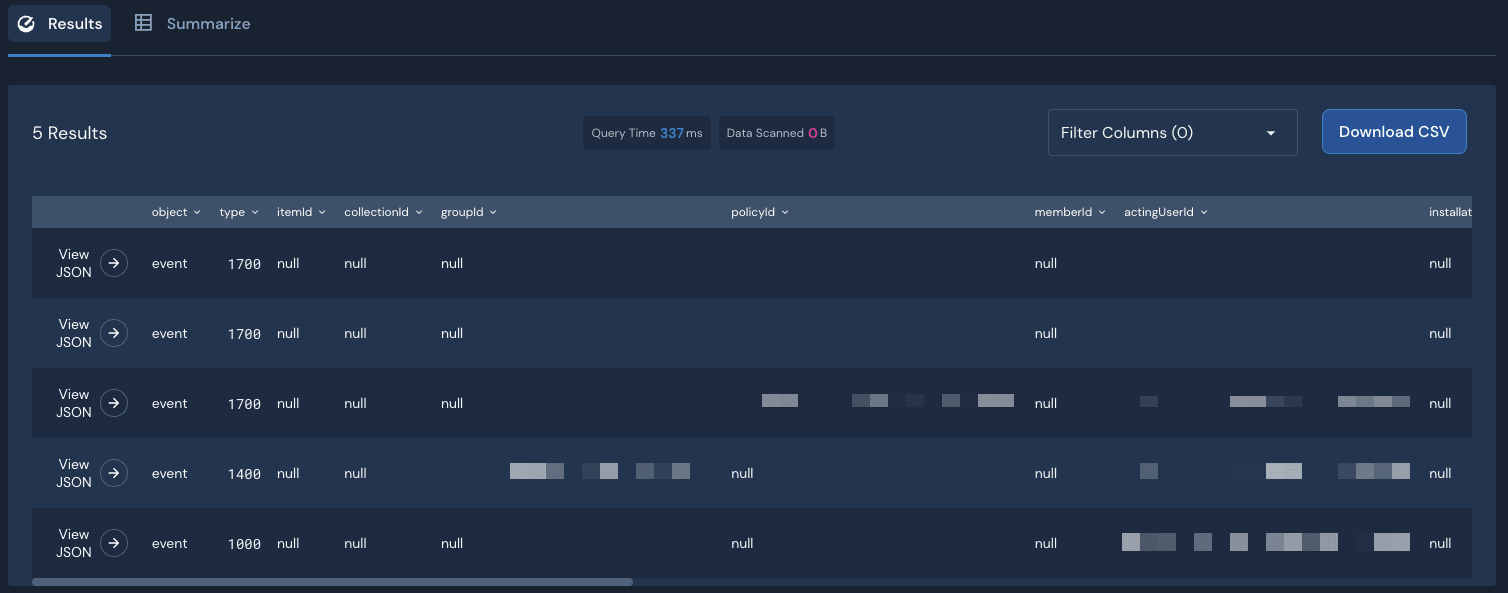
Panther Event Logs Events can be expanded and viewed in JSON by selecting View JSON. .

Panther JSON Object For additional information regarding Bitwarden organization events, see here. Additional options for specific queries are available, see the Panther Data Explorer documentation for more information.